Hindsight Goal Generation via Graph-Based Diversity and Proximity
Sim-To-Real Videos
In this video, we show the performances of GC-HGG in four challenging environments. The details of these four tasks are given in section "Experiments" in the manuscript. The real-world experiment videos are speed up by 160%. Example of failures are at the bottom of the page.
We will release the code of GC-HGG at this anonymous repository:
Ablation Study on η


Ablation Study on σ


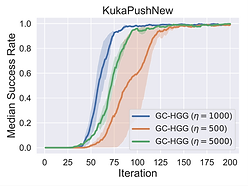
Figures above illustrate the success rates for various values of η in Eq.20 in all four environments. All plots show that GC-HGG is robust to changes in the value of η and demonstrates reasonable performance in all chosen configurations. In KukaReach, KukaPush, and KukaPickObstacle, there exit little difference of performance across different values of η. In KukaPickNoObstacle, the plot shows that GC-HGG performs best when η=1000, but other choices of η only show a slight degradation in sample efficiency.
Figures below show the success rates for various values of σ, where σ=0.3 gives the best performance. The plot shows that GC-HGG is robust to changes in the value of σ as well, but shows different sample efficiencies in KukaPickNoObstacle and KukaPickObstacle. From these two figures, We can see that the proximity metric has a positive impact on sample efficiency, since the distance metric can lead to the target goals more efficiently than heuristic exploration.


Figures above illustrate the success rates for various values of the grid size. The figure demonstrates that G-HGG is more sensitive to grid-size than GC-HGG. Although both of them can successfully finish the tasks, GC-HGG clearly demonstrates better sample efficiency and robustness to large grid size.


Figures above show that our trade-off mechanism has a better performance than CHER's naive mechanism, especially in challenging tasks such as KukaPickObstacle and KukaPickNoObstacle. The blue curve shows the performance of our original GC-HGG algorithm. The other three are GC-HGG with CHER's trade-off mechanism based on the exponential function $\lambda_k = (1 + \tau)^k \lambda_0$. We set $\lambda_0 = 1$ and select different $\tau$ to perform our experiments.


Figures above show the difference between the Euclidean distance and Graph-based distance. In the environment with obstacles like KukaPushNew, KukaPickObstacle, graph-based distances demonstrated a better performance. In terms of KukaPickObstacle, there is no much difference between graph-based distance and euclidean distance since there exists no obstacle in this environment.
Failure examples in the real world
Puch is pushed out of the working space.
The view of the puck is blocked by the arm.